We're glad to see you again. Login to access your charts, and create new ones.
Datawrapper helps you to publish your charts and maps in no time. Give it a try, registration takes less than a minute.
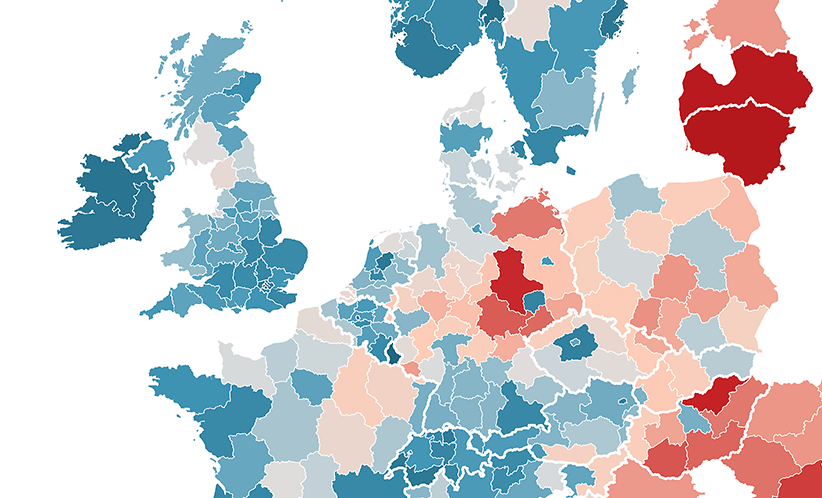
Color regions to show data like unemployment rates or election results on a map. Upload your own map or use any of our more than 1000 maps. The resulting map is responsive & interactive.
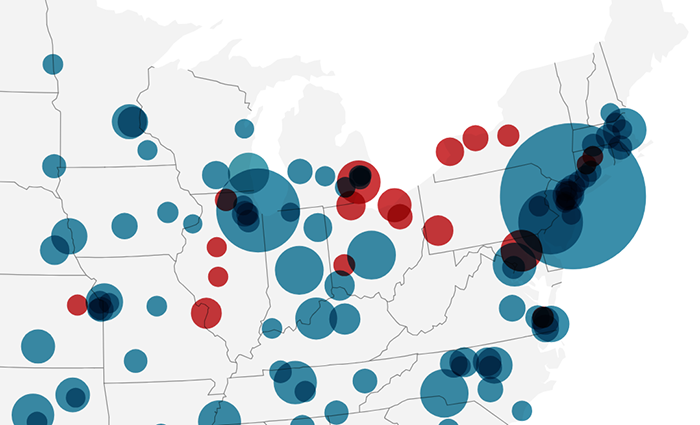
Create symbols sized and colored according to your data. Works great for specific locations (like cities). Upload your own map or use any of our more than 1000 maps. The resulting map is responsive & interactive.
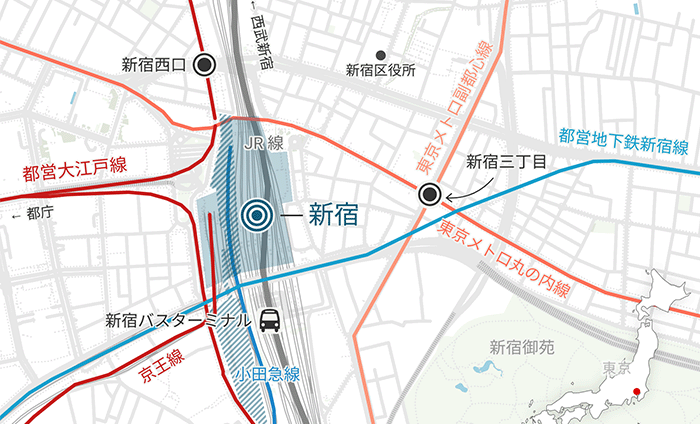
Add makers to a map to show where something is located or happened, e.g. events within a city. Perfect for showing readers the places you mention in an article. The resulting map is responsive and static.