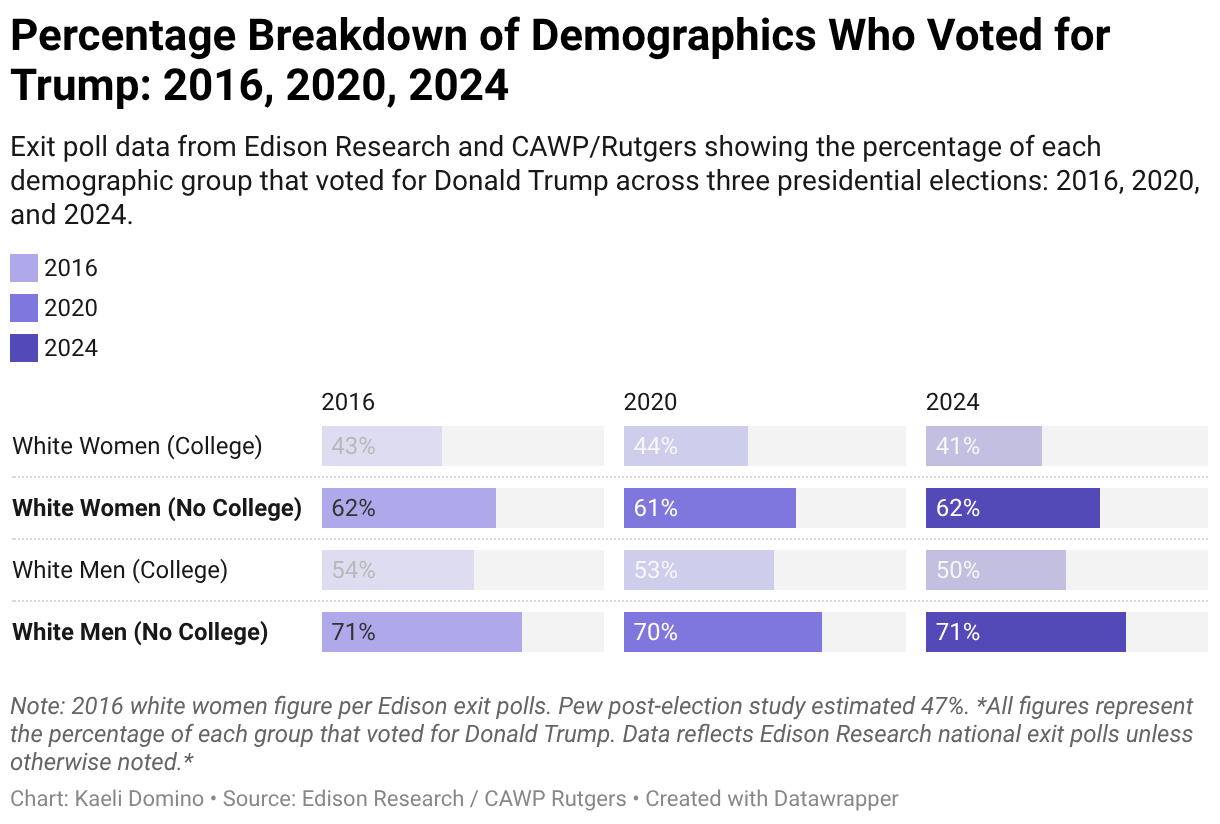
Percentage Breakdown of Demographics Who Voted for Trump: 2016, 2020, 2024
Exit poll data from Edison Research and CAWP/Rutgers showing the percentage of each demographic group that voted for Donald Trump across three presidential elections: 2016, 2020, and 2024.
Grouped bar chart showing the percentage of white voters who voted for Donald Trump in 2016, 2020, and 2024, broken down by gender and education level. White men without a college degree show the highest and most consistent support across all three elections at 71, 70, and 71 percent. White women without a college degree remain nearly identical at 62, 61, and 62 percent, highlighted as unchanged across all three elections. College educated white men show modest decline from 54 to 50 percent. College educated white women show the lowest support of any group at 43, 44, and 41 percent, and are the only group trending meaningfully downward.