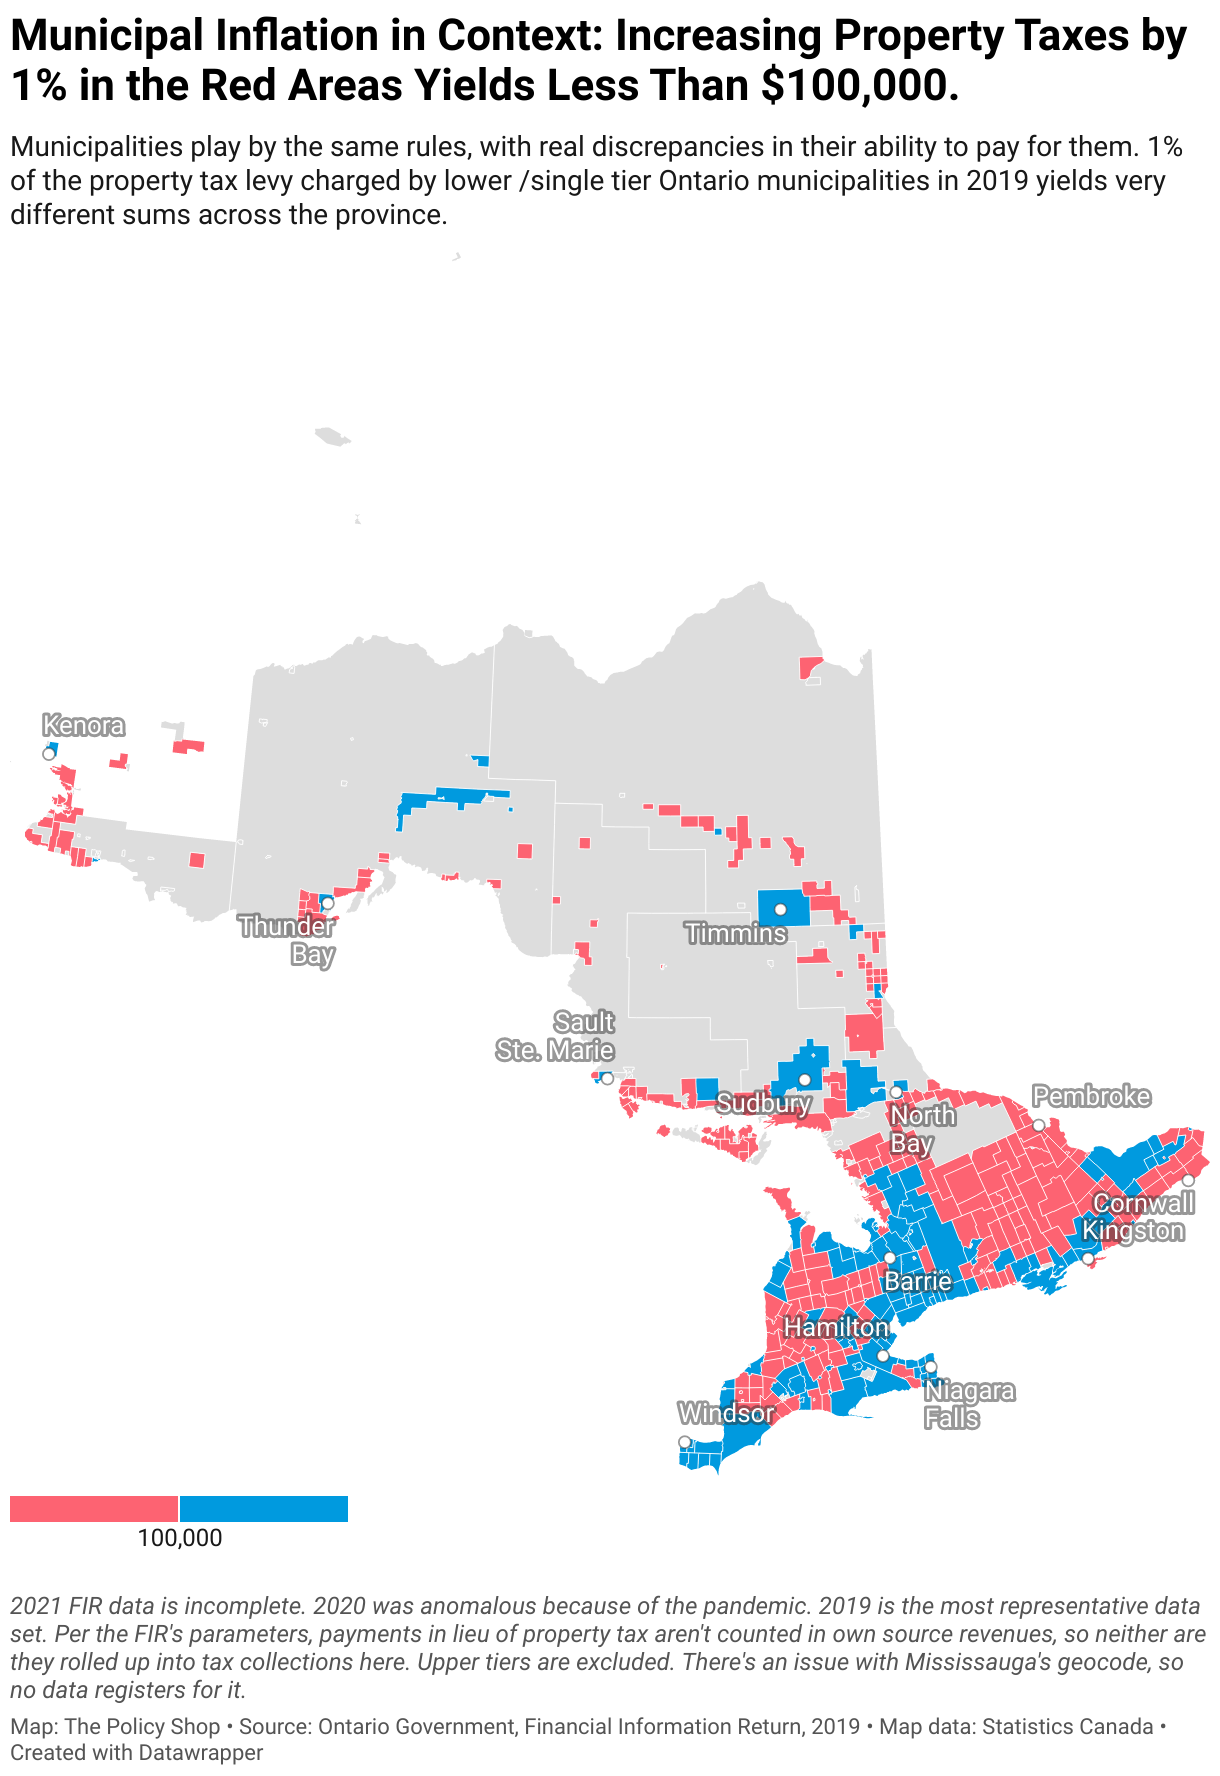
Municipal Inflation in Context: Increasing Property Taxes by 1% in the Red Areas Yields Less Than $100,000.

Municipalities play by the same rules, with real discrepancies in their ability to pay for them. 1% of the property tax levy charged by lower /single tier Ontario municipalities in 2019 yields very different sums across the province.

2021 FIR data is incomplete. 2020 was anomalous because of the pandemic. 2019 is the most representative data set. Per the FIR's parameters, payments in lieu of property tax aren't counted in own source revenues, so neither are they rolled up into tax collections here. Upper tiers are excluded. There's an issue with Mississauga's geocode, so no data registers for it.
Map: The Policy Shop Source: Ontario Government, Financial Information Return, 2019 Get the data Embed