Global Mean Temperature Rise time series
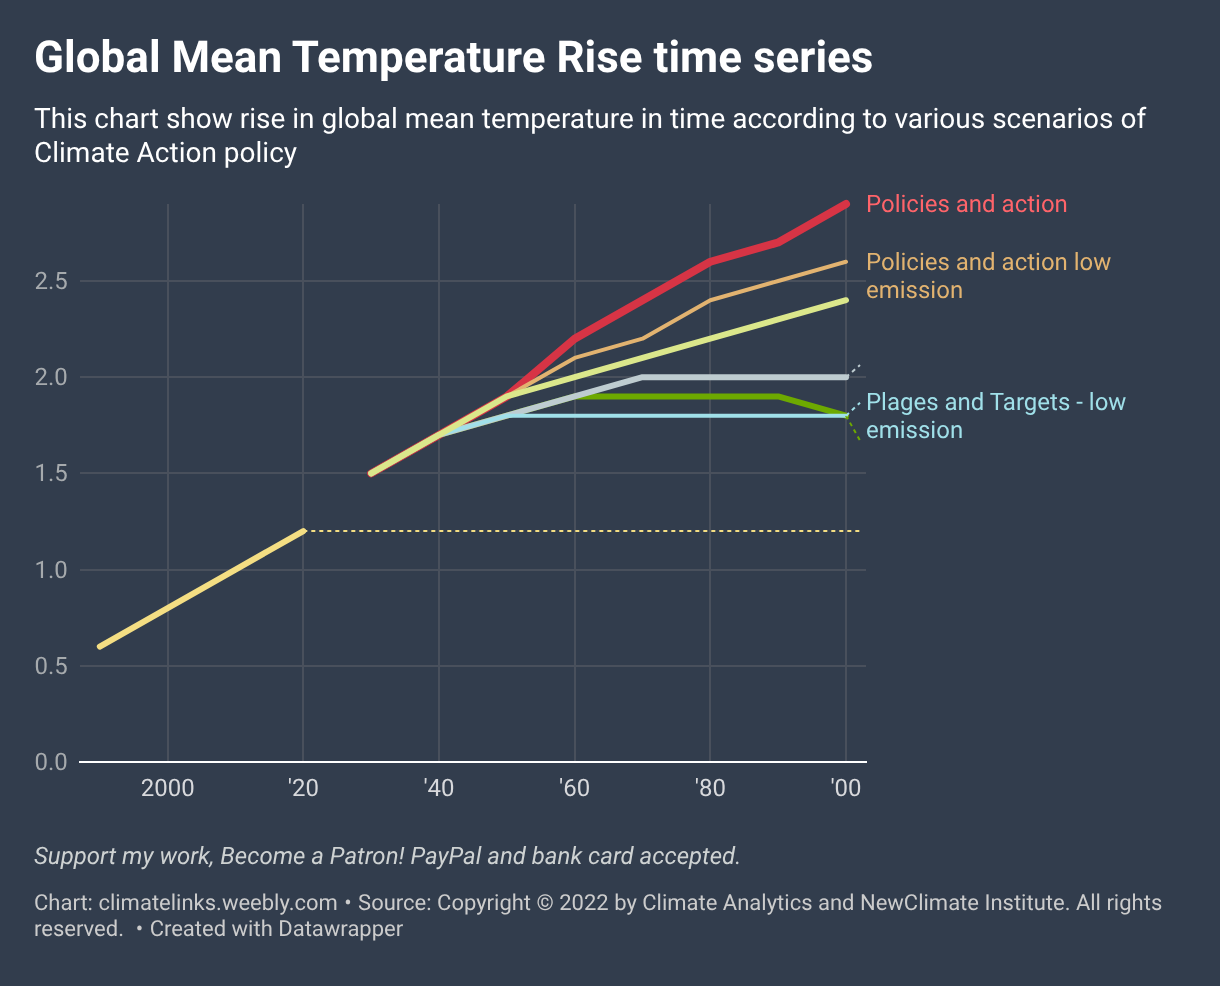
This chart show rise in global mean temperature in time according to various scenarios of Climate Action policy
This chart show rise in global mean temperature in time according to various scenarios of Climate Action policy
