India's Arms Imports from Israel Under UPA and BJP Governments
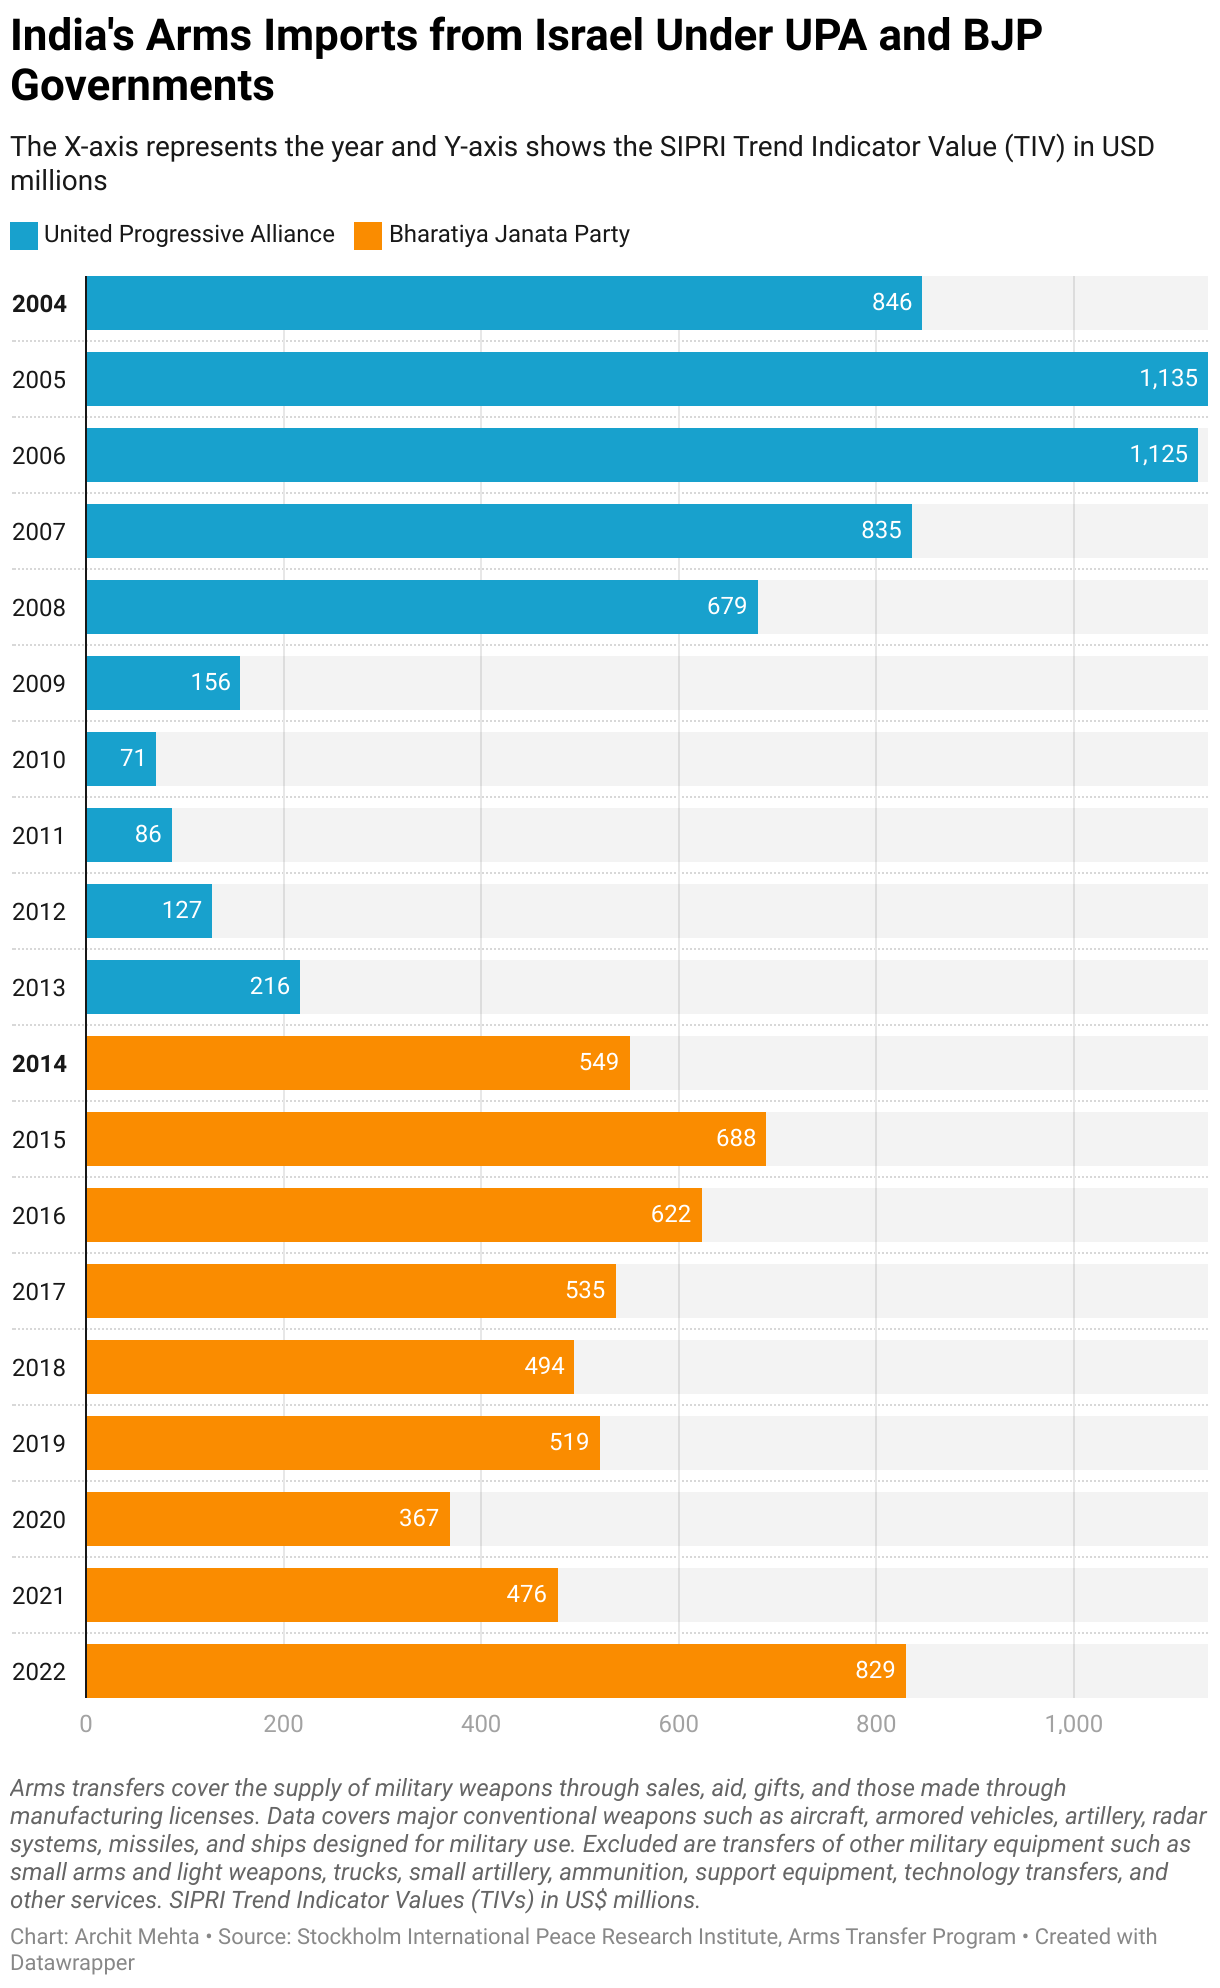
The X-axis represents the year and Y-axis shows the SIPRI Trend Indicator Value (TIV) in USD millions. TRI it is a measure of the military capability transferred.
This visualization shows arms imports to India from Israel under the UPA and BJP governments from 2004 to 2022. The data is presented in a horizontal bar chart format, with years listed from 2004 at the top to 2022 at the bottom. Each bar represents the amount of arms imported in a specific year, measured in millions of dollars. The bars are color-coded: blue for the UPA government (2004-2013) and orange for the BJP government (2014-2022).
Detailed Data:
2004: UPA, 846 million dollars
2005: UPA, 1,135 million dollars
2006: UPA, 1,125 million dollars
2007: UPA, 835 million dollars
2008: UPA, 679 million dollars
2009: UPA, 156 million dollars
2010: UPA, 71 million dollars
2011: UPA, 86 million dollars
2012: UPA, 127 million dollars
2013: UPA, 216 million dollars
2014: BJP, 549 million dollars
2015: BJP, 688 million dollars
2016: BJP, 622 million dollars
2017: BJP, 535 million dollars
2018: BJP, 494 million dollars
2019: BJP, 519 million dollars
2020: BJP, 367 million dollars
2021: BJP, 476 million dollars
2022: BJP, 829 million dollars
The chart highlights a significant drop in arms imports during the late years of the UPA government (2009-2013), followed by an increase in imports during the BJP government, peaking in 2022 with 829 million dollars.
Source and Credits
Source: Stockholm International Peace Research Institute, Arms Transfer Program
Chart by: Archit Mehta
Tool used: Datawrapper
