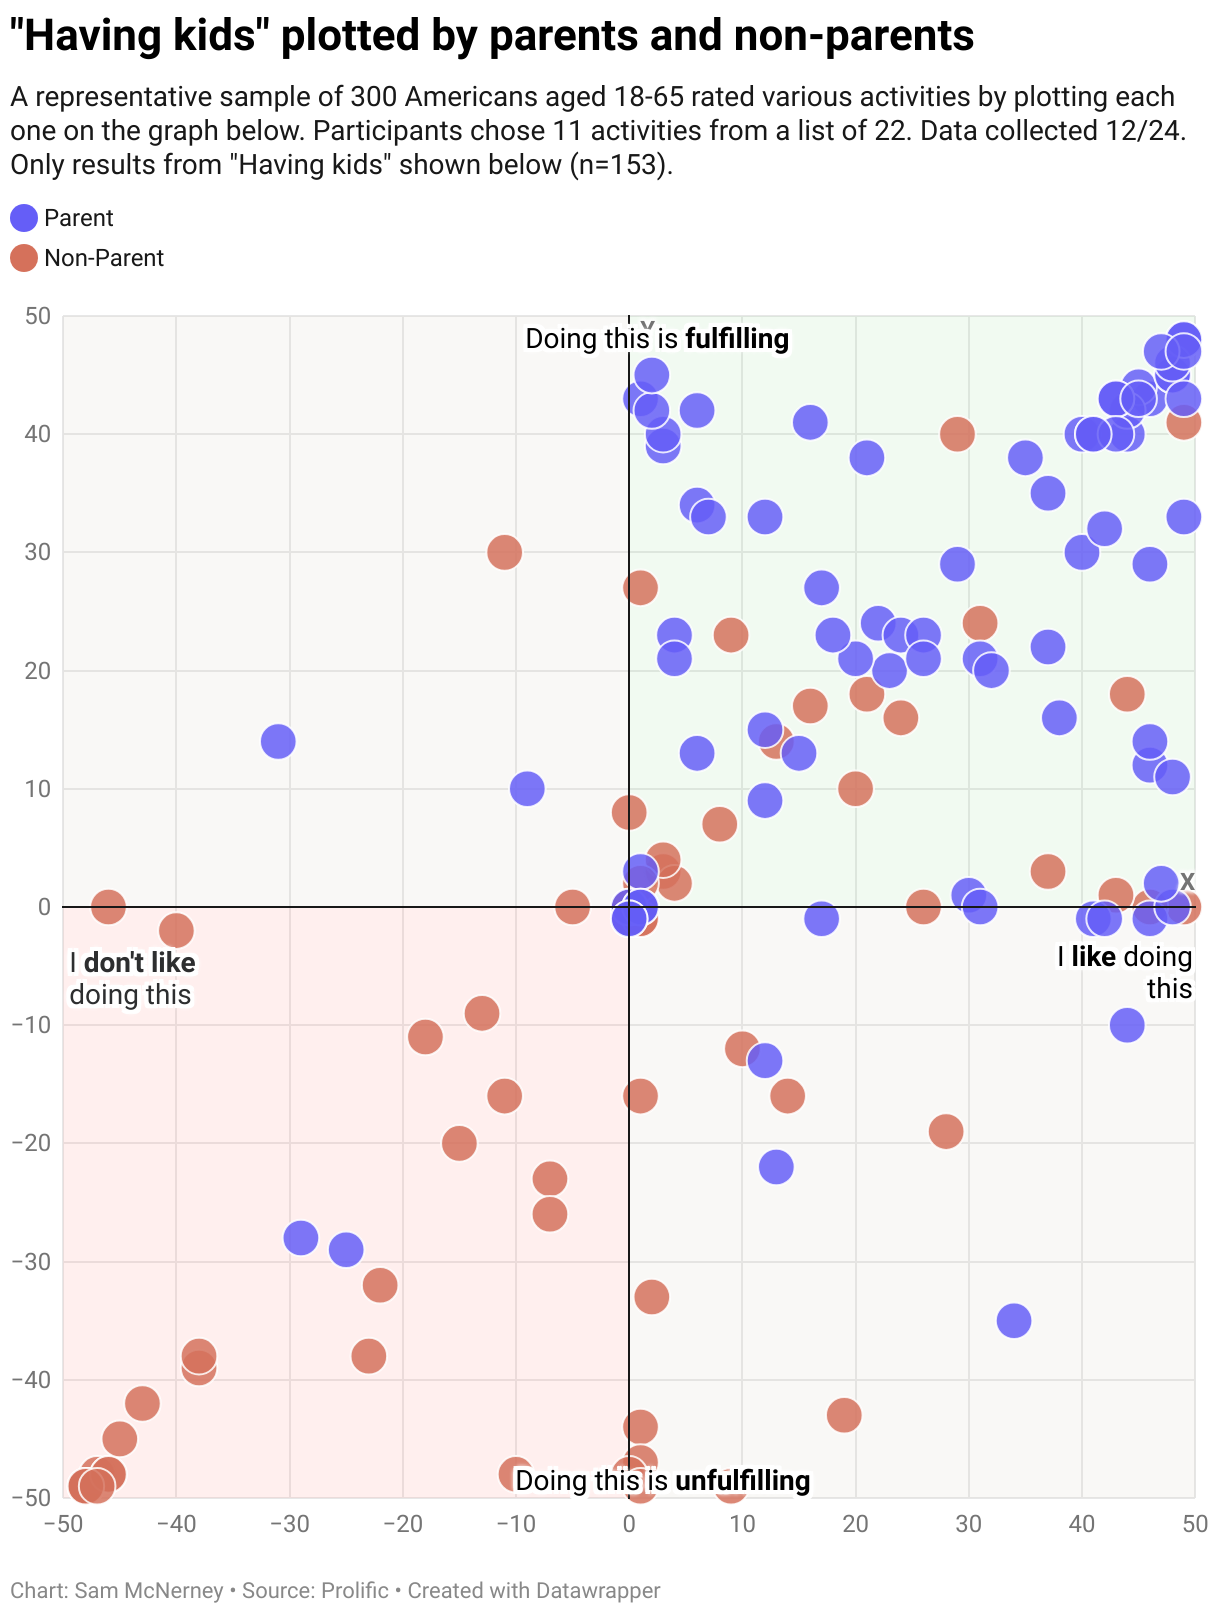
"Having kids" plotted by parents and non-parents
A representative sample of 300 Americans aged 18-65 rated various activities by plotting each one on the graph below. Participants chose 11 activities from a list of 22. Data collected 12/24. Only results from "Having kids" shown below (n=153).