Datawrapper logo
Create new …
Chart Map Table
Sign in
More
Language
Deutsch English français español italiano 中國的

River Academy

What kind of map do you want to create?

Choose the map type that fits your data:
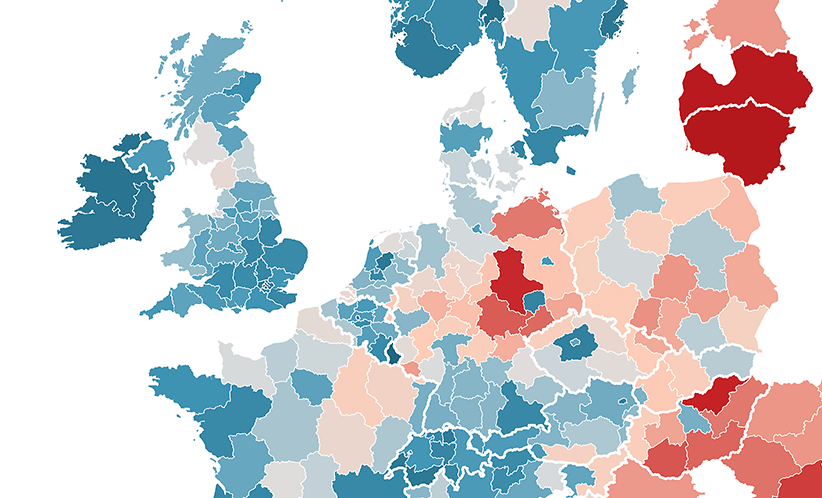
Choropleth map

Color regions to show data like unemployment rates or election results on a map. Upload your own map or use any of our more than 3000 maps. The resulting map is responsive & interactive.

Learn more about choropleth maps

Symbol map

Create symbols sized and colored according to your data. Works great for specific locations (like cities). Upload your own map or use any of our more than 3000 maps. The resulting map is responsive & interactive.

Learn more about symbol maps

Locator map

Add markers to a map to show where something is located or happened, e.g. events within a city. Perfect for showing readers the places you mention in an article. The resulting map is responsive and static.

Learn more about locator maps

Datawrapper is developed by Datawrapper GmbH.

  • We're Hiring
  • Academy
  • Blog
  • Terms
  • Privacy Policy
  • Imprint
  • Changelog
  • support@datawrapper.de
Back to top